This report is based on input from 25 freelance copy editors. 28 reported, but input from one was removed because the rate is based on a method not used by anyone else and two provided incomplete information. Three types of rates were used: Global monthly rates (similar to that of employees), hourly rates and per word rates. Most of the report currently deals with hourly rates because they were the most common and the most similar to those prepared in the technical writer surveys. Results of per word rates will be processed and added to this report later.
How Rates Were Calculated
The way rates are calculated affects the outcome. Rates below are calculated in units of rate per writer with no weight given to the number of hours each writer works. In other words Avg = (RateForA + RateForB) / NumberOfEditors.
For example, if writer A works 200 hours/mo and charges 50 NIS/hour, while writer B works 100 hours/mo and charges 100 NIS/hr the average is calculated as follows:Avg = (50 NIS + 100 NIS) / 2 = 75 NIS .
Calculated Hourly Rates vs. Hourly Only Rates
The hourly rate for copy editors who charge a global monthly amount had a lower hourly rate on average than those who charged strictly by an hourly rate. The reason for this is not clear. It may be that many of these copy editors work as subcontractors and it may be that they charge less in return for a more stable income.
Throughout this report global monthly rates were converted to hourly rates, with the exception of the General breakdown where both were listed.
Exchange Rates
Rates that were listed in $USD were converted to NIS at a rate of 4.25.
Average, Median and Percentiles
Average is calculated by adding up all salaries and dividing the sum by the number of salaries reported. Average = SUM / # of entries.
Median is what is the salary for the person in the middle, with the same number of people earning the same or more as those earning that salary or less.
Percentiles are a ranking of entries with the lowest at 1 and the highest at 100.
25% salary means that 25% charge that rate or less, and 75% earn that rate or more. This is a low-end salary - most writers earn more.
50% salary means that 50% charge that rate or less, and 50% earn that rate or more. This is what the average, run-of-the-mill technical writer should expect to earn.
75% salary means that 75% charge that rate or less, and 25% earn that rate or more. This is what a writer who is the starting point for a high-end salary.
90% salary means that 90% charge that rate or less, and 10% earn that rate or more. This is a high-end salary - these figures are not included in this report, but I do have them for personal consulting.
General
The hourly rate for copy editors who charge a global monthly amount had a lower hourly rate on average than those who charged strictly by an hourly rate. The reason for this is not clear. It may be that many of these copy editors work as subcontractors and it may be that they charge less in return for a more stable income.
Throughout this report global monthly rates were converted to hourly rates, with the exception of the General breakdown. The hourly only rate was added here to
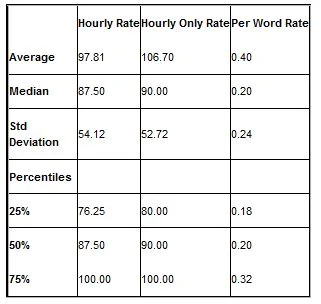
Hourly RateHourly Only RatePer Word Rate
Average97.81106.700.40
Median87.50
90.000.20
Std Deviation54.12
52.720.24
Percentiles
25%76.25
80.000.18
50%87.5090.000.20
75%100.00
100.000.32
Only 39% of those reporting gave a per word rate or a rate that could be converted to a per word rate (per page/250, etc). This includes participants who also gave time-based rates and those did not.

NIS per word
Average0.29
Median0.20
Std Deviation0.24
Percentiles
25%0.18
50%0.20
75%0.32
Professional Organizations
Not calculated yet.
AffiliationNo Affiliation
Average
Median
Std Deviation
Percentiles
25%
50%
75%
% of total
Experience
70% of those reporting have more than 10 years experience. It is interesting to note that those with 5-10 years experience get higher rates than those with over 10 years experience.
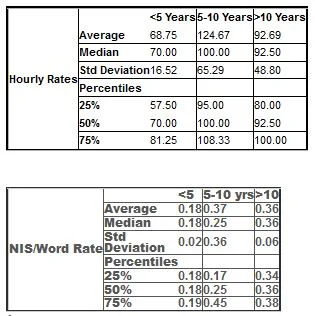
Hourly Rates
<5 Years5-10 Years>10 Years
Average68.75
124.67
92.69
Median70.00
100.00
92.50
Std Deviation16.52
65.29
48.80
Percentiles
25%57.50
95.00
80.00
50%70.00
100.00
92.50
75%81.25
108.33
100.00
NIS/Word Rate
<55-10 yrs>10
Average0.180.370.36
Median0.180.250.36
Std Deviation0.020.360.06
Percentiles
25%0.180.170.34
50%0.180.250.36
75%0.190.450.38
Age
A little under half of the copy editors are under 50 and a little over half are 50+ years old.
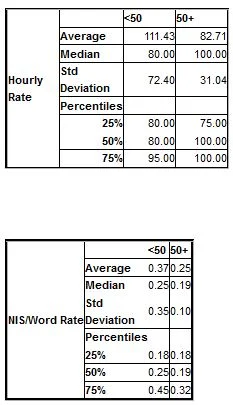
Hourly Rate
<5050+
Average111.4382.71
Median80.00100.00
Std Deviation72.4031.04
Percentiles
25%80.0075.00
50%80.00100.00
75%95.00100.00
NIS/Word Rate
<5050+
Average0.370.25
Median0.250.19
Std Deviation0.350.10
Percentiles
25%0.180.18
50%0.250.19
75%0.450.32
Geography
Unlike with technical writing, the 03 area code is far and away the best paying area code for copy editing. There was too little data to prepare per word breakdowns by area code.
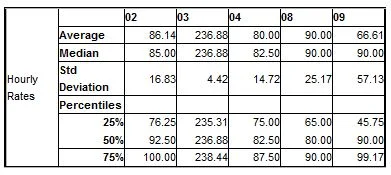
Hourly Rates
02 03 04
08
09
Average86.14236.8880.0090.0066.61
Median85.00236.8882.5090.0090.00
Std Deviation16.834.4214.7225.1757.13
Percentiles
25%76.25235.3175.0065.0045.75
50%92.50236.8882.5080.0090.00
75%100.00238.4487.5090.0099.17
Sex
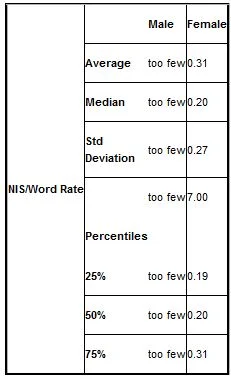
Of the 20 respondants whose rates could be converted to an hourly basis only 2 were male. This is too small a sampling to give useful results.
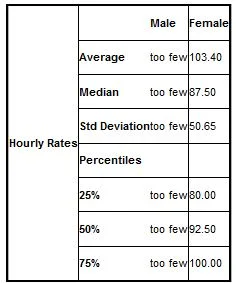
Hourly Rates
Male Female
Averagetoo few103.40
Mediantoo few87.50
Std Deviationtoo few50.65
Percentiles
25%too few80.00
50%too few92.50
75%too few100.00
NIS/Word Rate
MaleFemale
Averagetoo few0.31
Mediantoo few0.20
Std Deviationtoo few0.27
too few7.00
Percentiles
25%too few0.19
50%too few0.20
75%too few0.31