Please remember that this report is copyrighted and for your own personal use only! You can show it to an employer or potential employer during salary negotiations, but not give out access or leave printed copies.Company access is for use by one person in the company.
This report is based on the full group of 133 salaried technical and marketing writers who reported between Oct. 1, 2006 and Dec. 31, 2006. Comparisons with Q1 2007 will be based on results from the control group of writers that also reported in Q1 2007 as salaried writers (does not include those who became freelance writers or moved to the new copy editors survey).
Percentages were rounded according to mathematical rounding rules, so the sum of percentages may equal 99 or 101%.
Adjusted Salaries
The salaries are adjusted to include the value of a company car. When no car is taken, the adjusted salary is the same as the gross salary. When an employee gives up gross salary in return for a car, that amount is added to the gross salary. When an employee receives a car in addition to salary, an estimated value of the car is added to gross salary based on the cost to the employer or other information available. In special cases where a minimum annual bonus or 13th month salary is known, the monthly equivalent is also included in the adjusted salary.
Adjusted salaries do not include performance bonuses, value of stock options, educational fund, pension or other benefits.
Average, Median and Percentiles
Average is calculated by adding up all salaries and dividing the sum by the number of salaries reported. Average = SUM / # of entries.
Median is what is the salary for the person in the middle, with the same number of people earning the same or more as those earning that salary or less.
Percentiles are a ranking of entries with the lowest at 1 and the highest at 100.
25% salary means that 25% earn that salary or less, and 75% earn that salary or more. This is a low-end salary - most writers earn more.
50% salary means that 50% earn that salary or less, and 50% earn that salary or more. This is what the average, run-of-the-mill technical writer should expect to earn.
75% salary means that 75% earn that salary or less, and 25% earn that salary or more. This is what a writer who is the starting point for a high-end salary.
90% salary means that 90% earn that salary or less, and 10% earn that salary or more. This is a high-end salary - these figures are not included in this report, but I do have them for personal consulting.
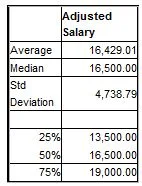
Adjusted Salary
Average16,429.01
Median16,500.00
Std Deviation4,738.79
25%13,500.00
50%16,500.00
75%19,000.00
Professional Organizations
22% of those reporting were paid members of at least one professional organization (some belonged to more than one). 18% reported being members of the STC and 11% reported being members of Elephant. Memberships in all other relevant professional organizations were negligable. The percentages of writers in the subset of writers that also participated in the Q1 2007 survey were higher (26% overall, 21% STC and 15% Elephant).
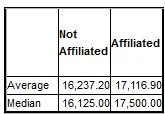
Not Affiliated
Affiliated
Average16,237.2017,116.90
Median16,125.0017,500.00
Writer Types
74% reported being technical writers, 6% marcom writers*, 12% documentation managers, and the remainder were either spread among other categories or did not respond to this question.
*The number of marcom writers is under reported because the job title for many of the technical writers was Technical/Marketing Writer.
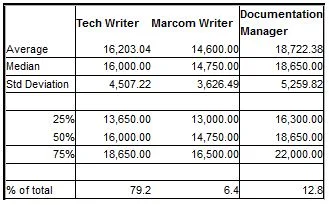
Tech WriterMarcom WriterDocumentation Manager
Average16,203.0414,600.0018,722.38
Median16,000.0014,750.0018,650.00
Std Deviation4,507.223,626.495,259.82
25%13,650.0013,000.0016,300.00
50%16,000.0014,750.0018,650.00
75%18,650.0016,500.0022,000.00
% of total79.26.412.8
Age and Experience
23% reported having less than 5 years experience, 41% had 5-10 years experience, and 36% had 10+ years experience. Salaries were significantly higher for those with 20+ years experience, but they only represented 9% of all writers. In order to keep relatively even sized age groups, salaries are divided into three groups: under 40 (32%), 40-49 (34%), and 50+ (33%).
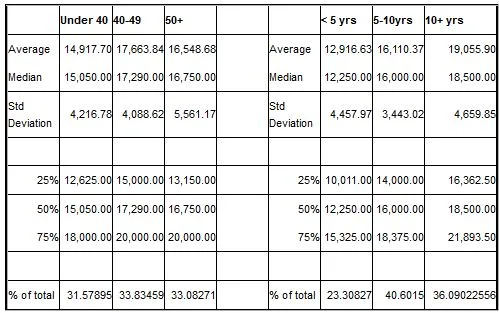
Under 4040-4950+
< 5 yrs5-10yrs10+ yrs
Average14,917.7017,663.8416,548.68
Average12,916.6316,110.3719,055.90
Median15,050.0017,290.0016,750.00
Median12,250.0016,000.0018,500.00
Std Deviation4,216.784,088.625,561.17
Std Deviation4,457.973,443.024,659.85
25%12,625.0015,000.0013,150.00
25%10,011.0014,000.0016,362.50
50%15,050.0017,290.0016,750.00
50%12,250.0016,000.0018,500.00
75%18,000.0020,000.0020,000.00
75%15,325.0018,375.0021,893.50
% of total31.5789533.8345933.08271
% of total23.3082740.601536.09022556
Company Size
20% reported working for small companies of up to 50 employees, 25% at companies with 50-100 employees, 17% at companies with 101-300 employees and 39% at companies with 301+ employees.
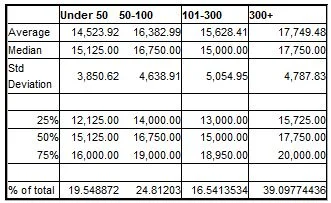
Under 5050-100101-300300+
Average14,523.9216,382.9915,628.4117,749.48
Median15,125.0016,750.0015,000.0017,750.00
Std Deviation3,850.624,638.915,054.954,787.83
25%12,125.0014,000.0013,000.0015,725.00
50%15,125.0016,750.0015,000.0017,750.00
75%16,000.0019,000.0018,950.0020,000.00
% of total19.54887224.8120316.541353439.09774436
Geography
Traditionally this has been considered to have a major impact on salary. At the start of 2006 this did not appear to be true, with the exception of salaries for women in the Jerusalem area. As the demand for writers increased during the year, this changed and geography once again became a major factor. Throughout 2006 the relationship between home and work area codes also changed and appears to be an important early warning sign of growth or slowdown in the job market for technical/marcom writers. So if you are thinking of changing jobs, asking for a raise, or concerned about layoffs, then this is an indicator to watch. Salaries are only given by work area code because that appears to be the only relevant salary indicator. One last note about geography is that there is also relationship between geography and whether writers work as freelancers or company employees.
This is especially true when comparing salaries in the 04 area code (northern Israel) with those of the 09 area code. In 04 salaries have not been increasing and an unusually high percentage of writers work as freelancers, while in 09 salaries have been growing steadily and the percentage of freelance writers is much lower. This pattern is also confirmed by nonstatistical sources.

Adj Salary 02Adj Salary 03Adj Salary 04Adj Salary 08Adj Salary 09
Average15,641.1116,695.7314,010.3714,734.0018,003.00
Median16,000.0016,000.0015,000.0017,000.0018,000.00
Std Deviation4,239.794,500.633,646.215,969.045,052.53
25%12,375.0013,900.0011,550.0013,500.0015,212.50
50%16,000.0016,000.0015,000.0017,000.0018,000.00
75%18,891.5019,300.0016,580.0018,625.0021,000.00
Sex
This title is always an attention getter, but there appears to be very little sex discrimination in technical/marcom writing. Salaries for male and female employees have been consistently close throughout the year, both nationwide and in all area codes except 02. The gap in the 02 area code has narrowed over the course of 2006. The number of writers is also very close to even both nationwide (53% male, 47% female) and in all geographic areas. The only area where the difference in number of male or female writers was somewhat significant was 03, where there were 20% more male writers.
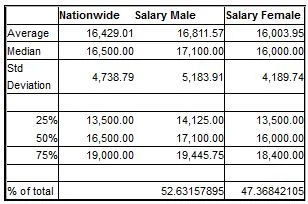
NationwideSalary MaleSalary Female
Average16,429.0116,811.5716,003.95
Median16,500.0017,100.0016,000.00
Std Deviation4,738.795,183.914,189.74
25%13,500.0014,125.0013,500.00
50%16,500.0017,100.0016,000.00
75%19,000.0019,445.7518,400.00
% of total
52.6315789547.36842105
Pension/Bituach Menehalim
The table below shows what percentage of gross salary the plan is based on.

100%80%LessNone
72.0041.0010.0010.00
% of total54.1353430.827077.5187977.518797
Education Fund (Keren Hishtalmut)
The table below shows what percentage of gross salary the employer pays into the plan. Employees must pay 2.5% into the plan.
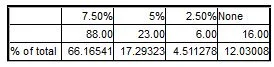
7.50%5%2.50%None
88.0023.006.0016.00
% of total66.1654117.293234.51127812.03008
Salary Increases (Raises and Job Changes)
This statistic is only based on the 69 writers who reported in previous quarters and again in Q4. This does not include the 64 writers who reported in Q4 but not in previous quarters, and those writers who reported before Oct. 1 but did not update their data in Q4. There are two sets of figures, one includes those who reported no change and may be expecting a raise in Q1; the other only includes those who reported a change (some of these writers actually received more than one raise during the course of 2006 or changed jobs and later received a raise).
It is important to note that many companies have annual salary negotiations during Q4, with raises taking place at the end of Q4 or start of Q1. Since the survey began in 2006 and reporting was low during Q1 2006, you really need to add in the Q1 2007 salary changes to fully understand the importance of the Q4 salary changes.
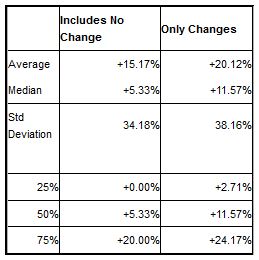
Includes No ChangeOnly Changes
Average+15.17%+20.12%
Median+5.33%+11.57%
Std Deviation34.18%38.16%
25%+0.00%+2.71%
50%+5.33%+11.57%
75%+20.00%+24.17%